COVID-19 Data Analysis A to Z
2021
Overview
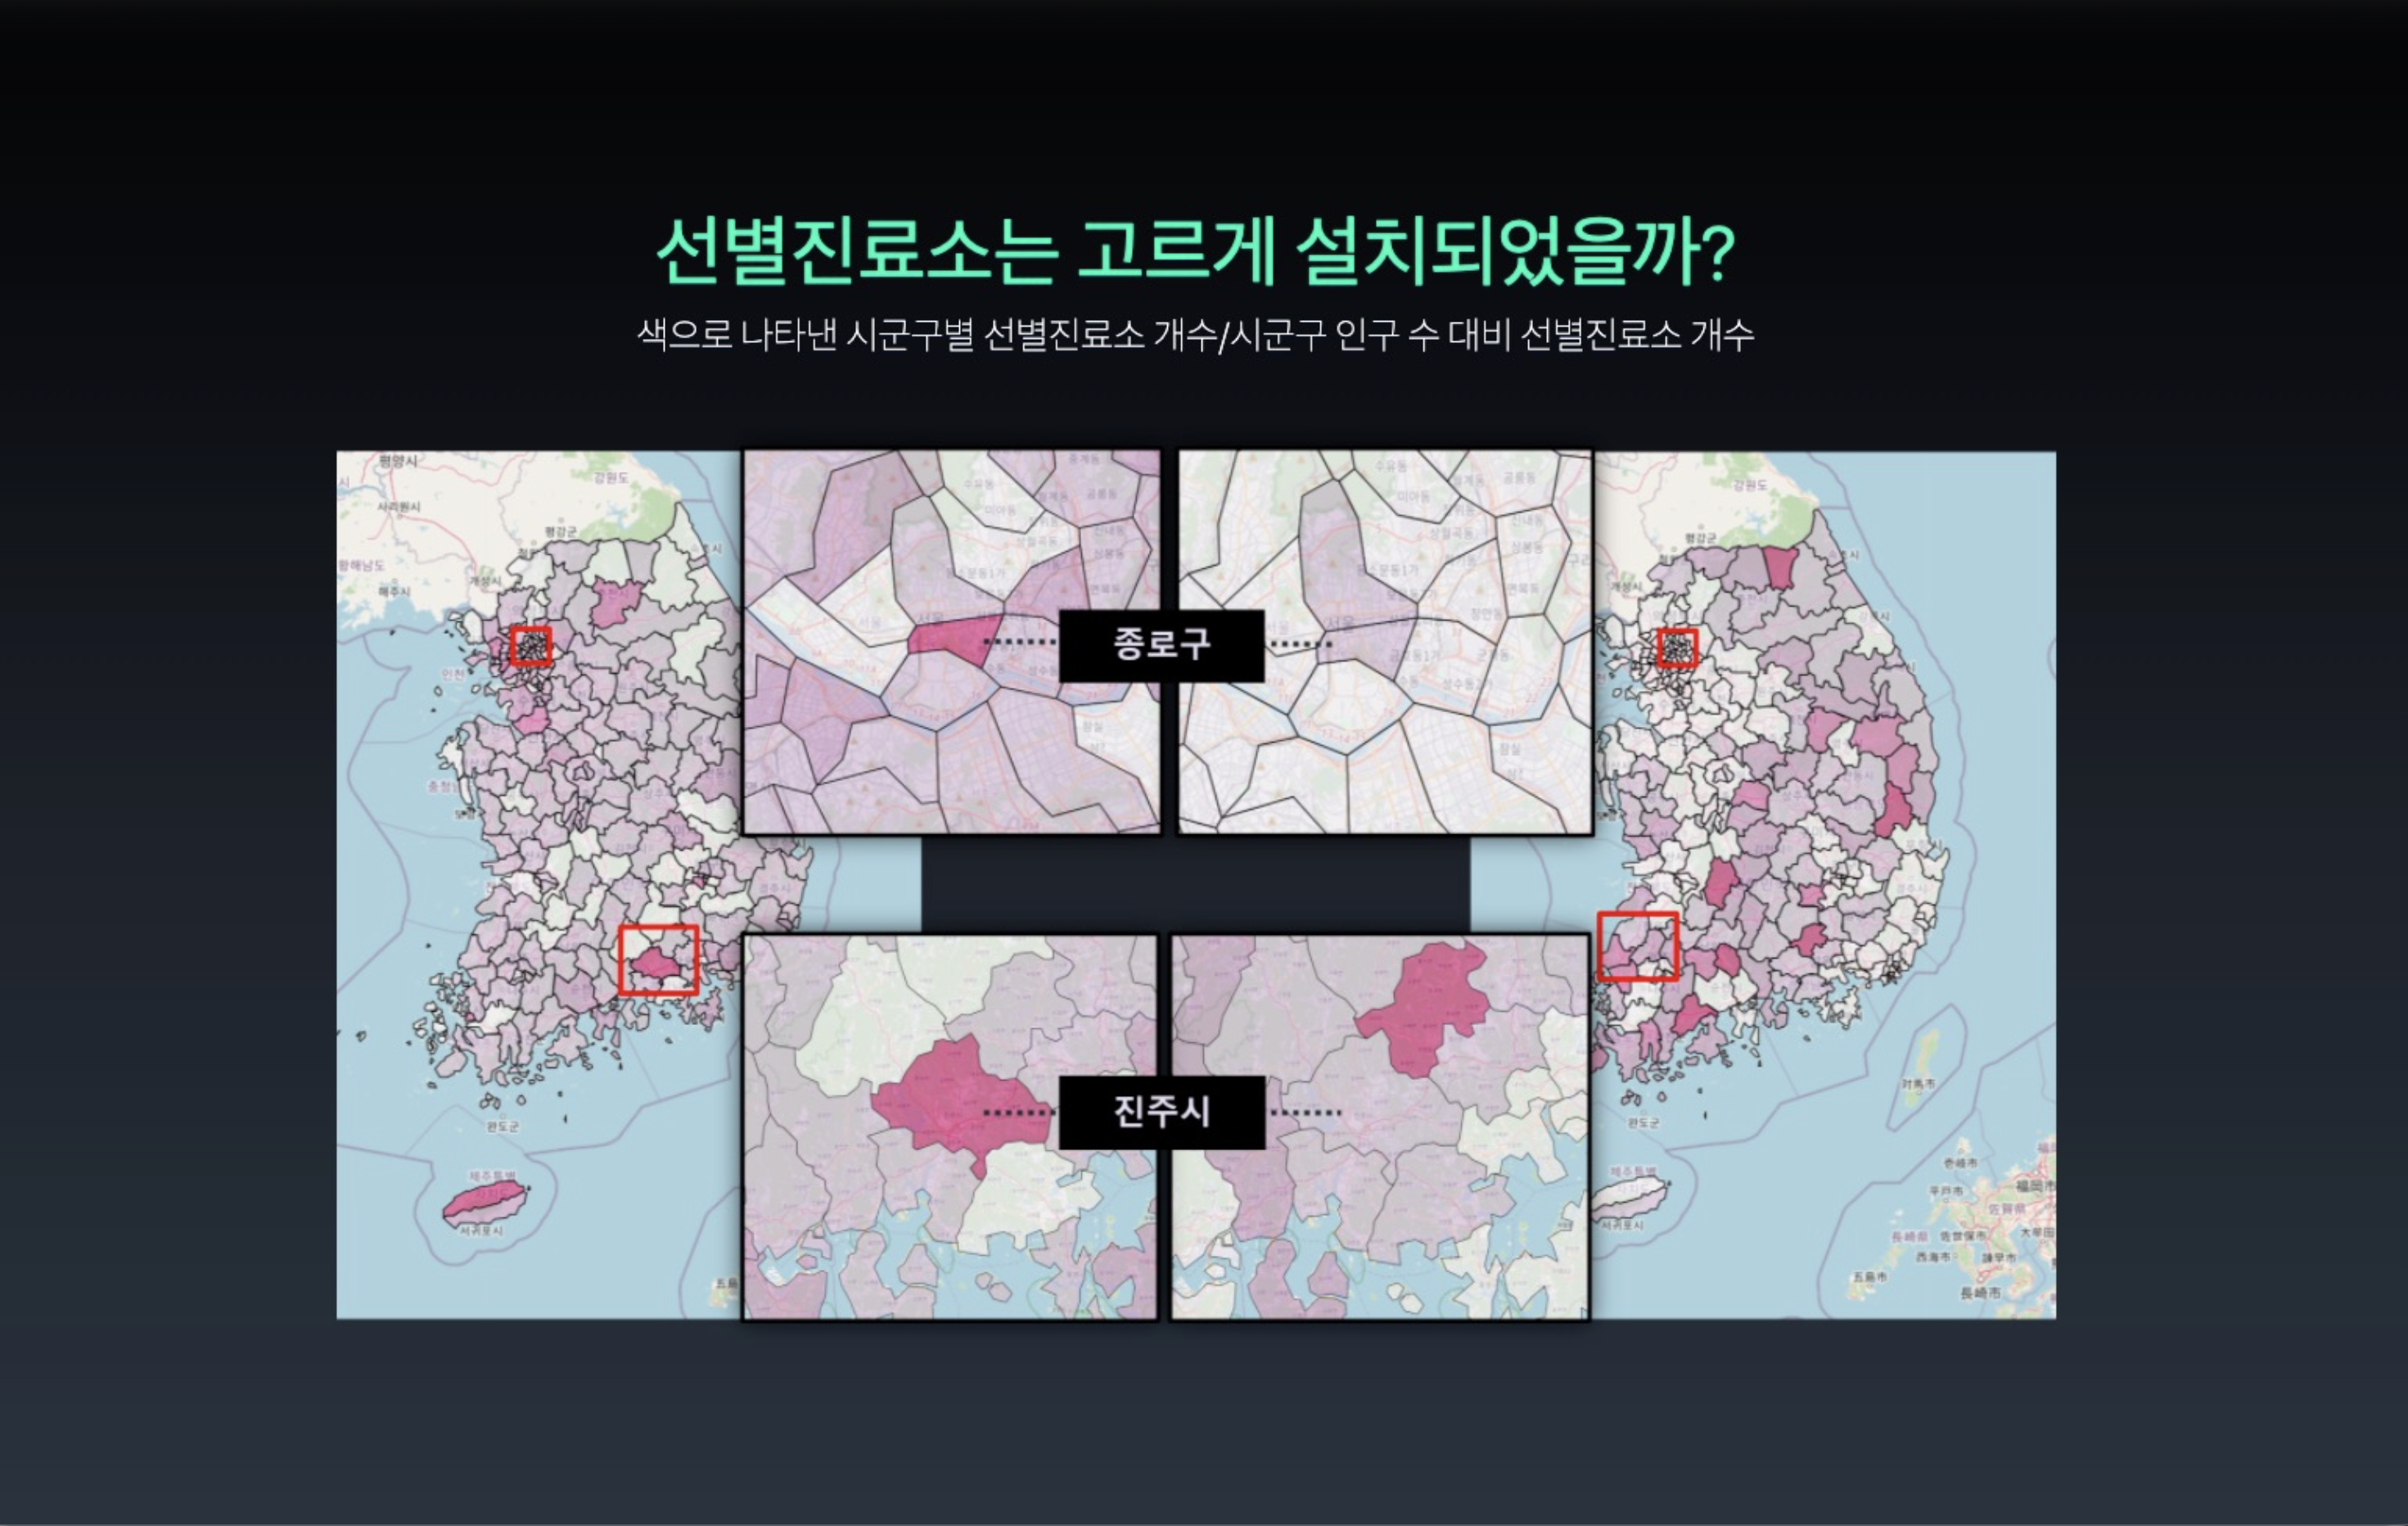
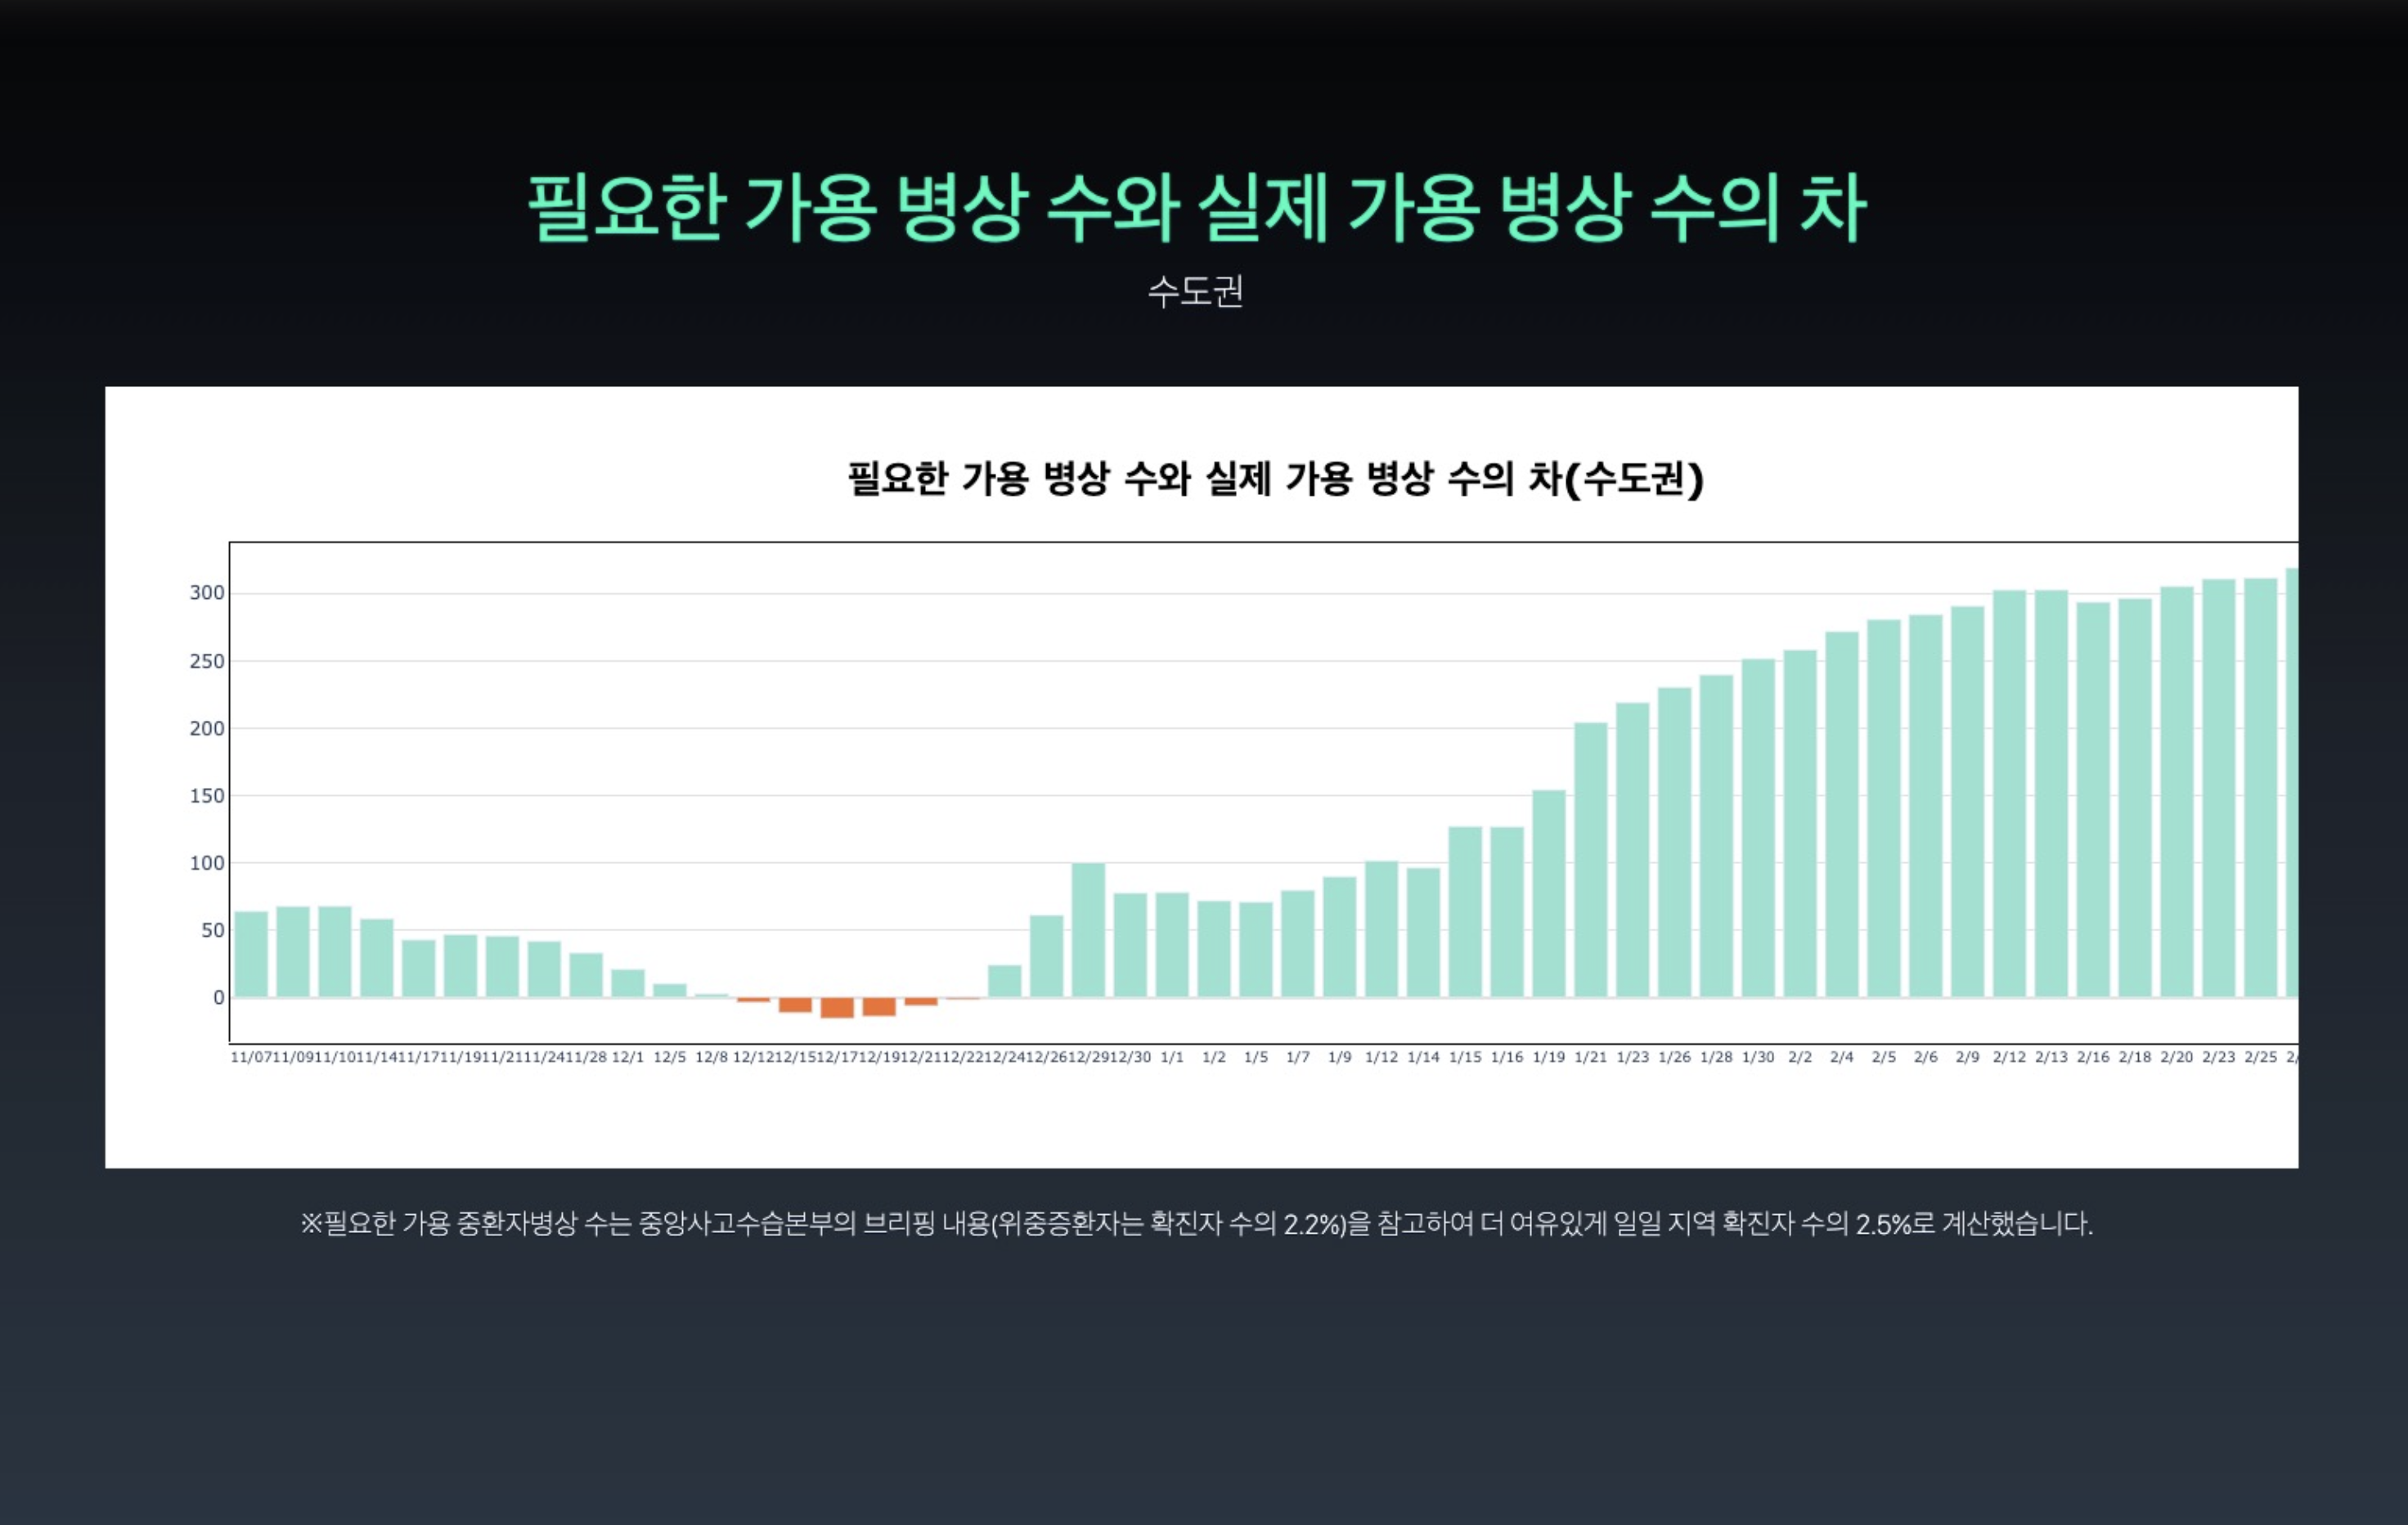
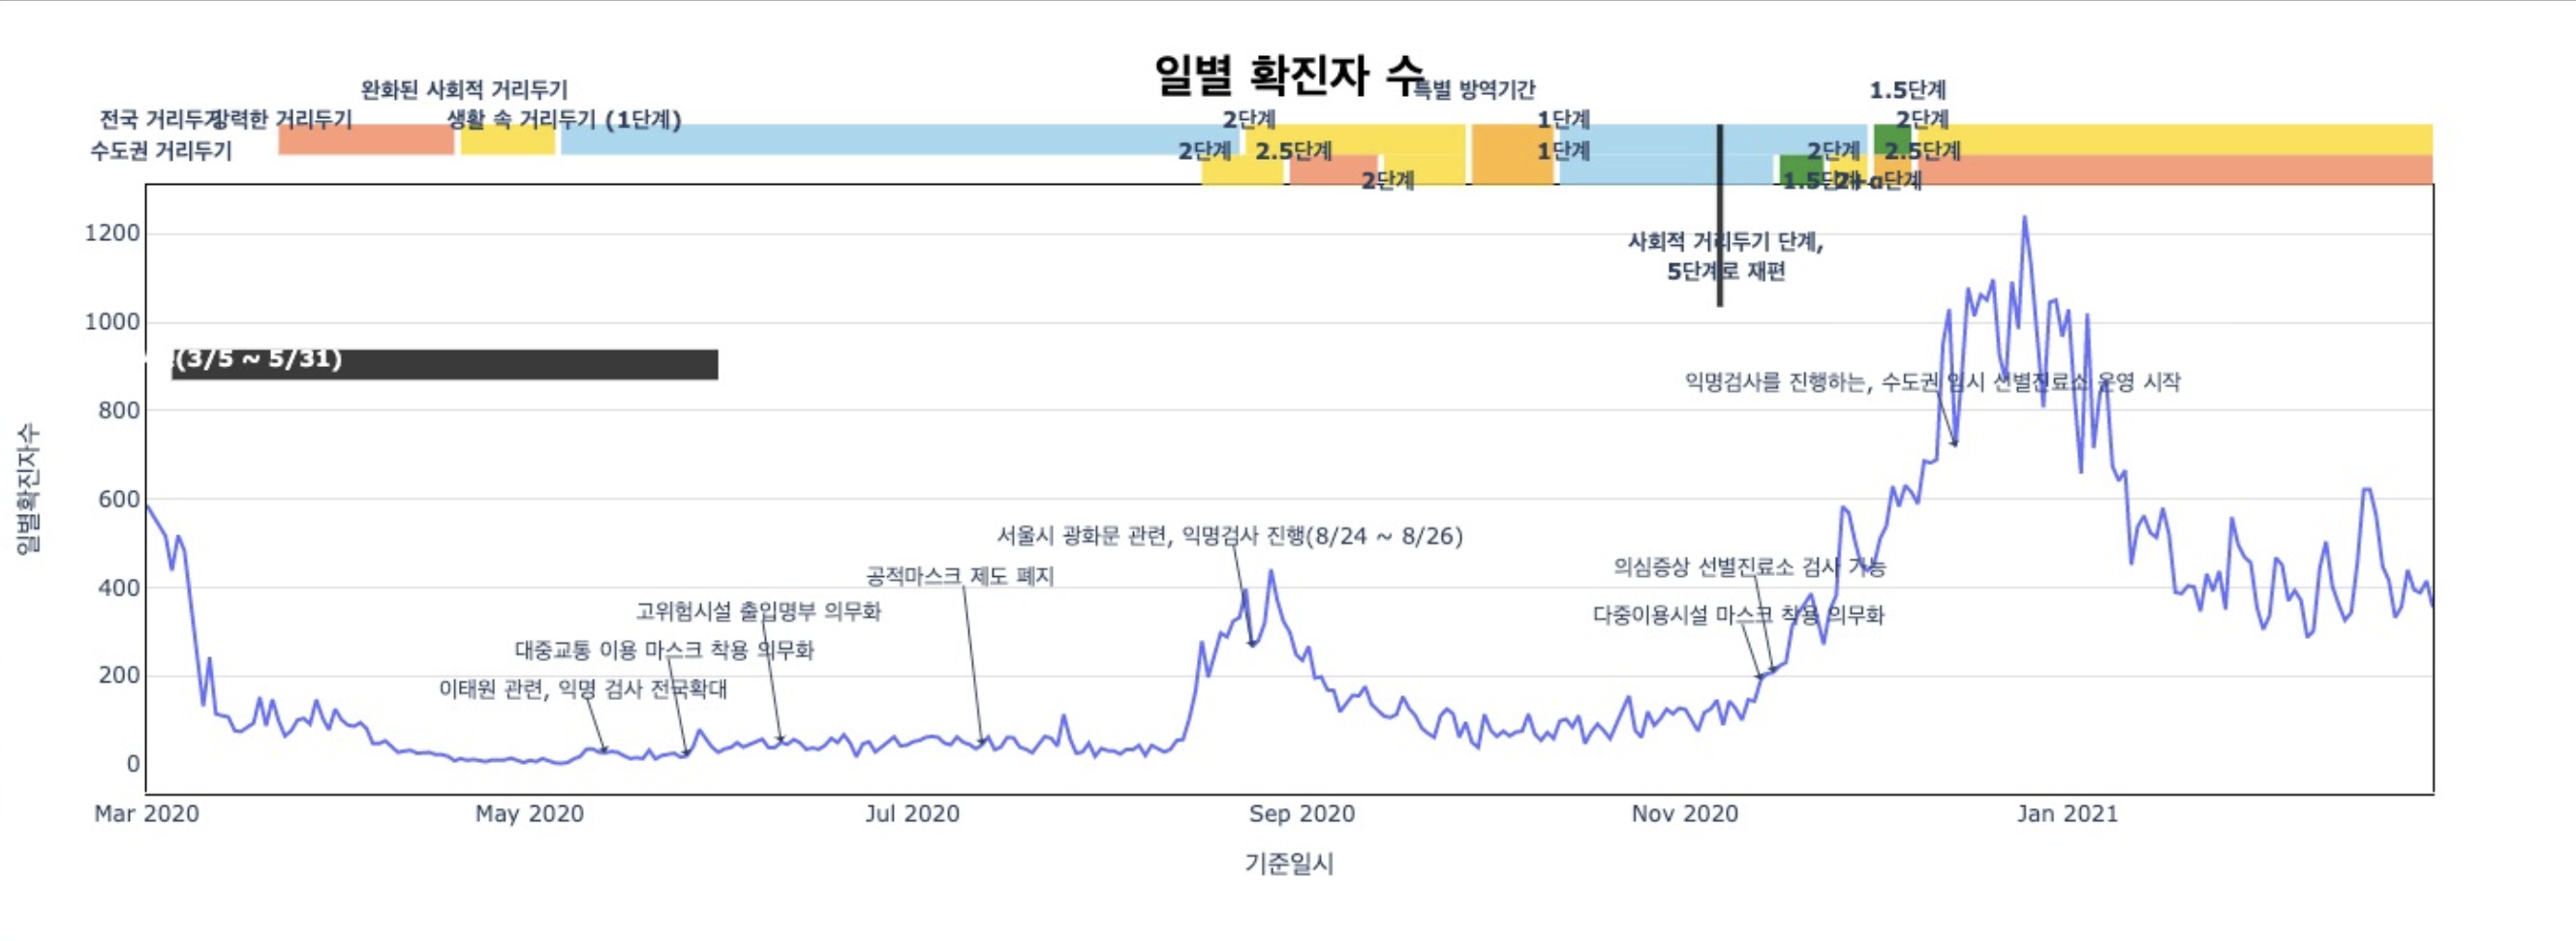
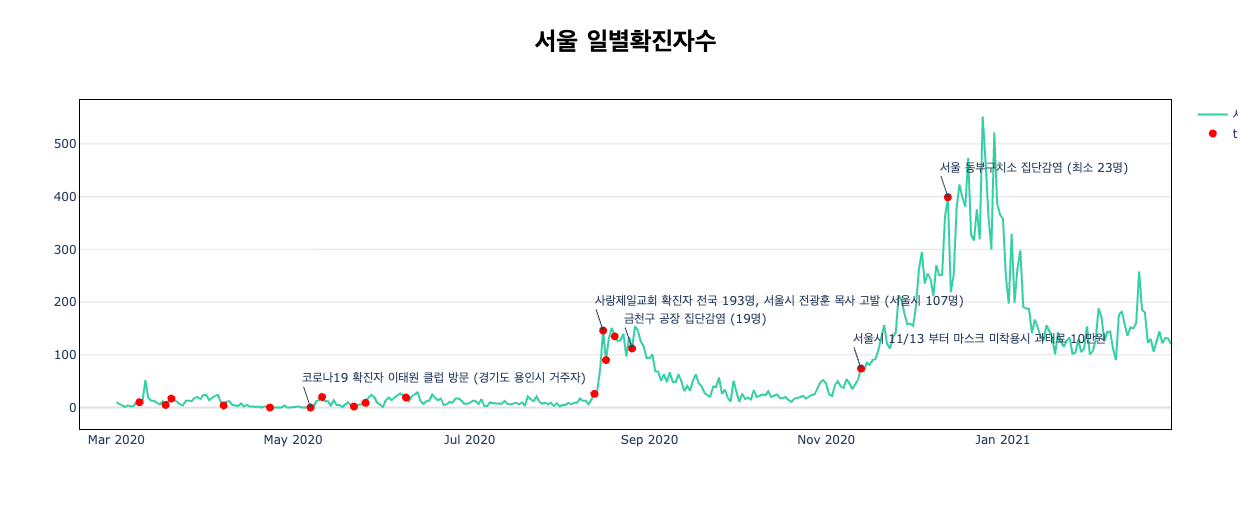
The "Data Gap" in Public Health During the height of the pandemic, public attention was focused on infection rates, but the underlying infrastructure remained opaque. My team discovered that limited public APIs prevented critical analysis of healthcare capacity. We initiated a project to scrape and analyze alternative datasets to audit the government's response. Revealing Regional Inequality Our analysis exposed a severe capital-centric bias in South Korea's healthcare system. By mapping the ratio of screening facilities and hospital beds to local populations, we demonstrated that resources were disproportionately concentrated in Seoul. We visualized these findings using interactive maps, proving that the lack of distribution guidelines was reinforcing existing inequalities. Combatting Misinformation Beyond infrastructure, we addressed the "infodemic." I developed a visualization of policy changes and an interactive map tracing mass infection clusters to their media coverage. These tools provided the public with a clear, fact-based timeline of the crisis. Policy Impact This work went beyond academic analysis. I presented our policy recommendations at International Open Data Day 2021, supported by the Open Knowledge Foundation and the Ministry of the Interior and Safety. Recognizing its value as a digital record of the crisis, the project was officially donated to the National Public Library of Korea, becoming its first non-governmental digital archive entry.
Project Gallery
Project Details
2021
Completed
Key Outcomes
- Donated to the National Public Library of Korea